Environmental hazards present risk for all homeowners throughout the U.S. Certain areas are well known for the risks they entail, but there are those ZIP codes that still fly under the radar for environmental hazards despite being hot spots.
According to recent research by ATTOM Data Solutions, 17.3 million single-family homes and condominiums with a combined estimated market value of $4.9 trillion are in ZIP codes with high or very high risk for at least one of four environmental hazards:
- Superfunds (sites contaminated with pollutants and other harmful substances)
- Brownfields (properties that may have hazardous substances, pollutants or contaminants present)
- Polluters
- Poor air quality
The 17.3 million single family homes and condos in high-risk ZIP codes represented 25 percent of the 68.1 million single-family homes and condos in the 8,642 ZIP codes analyzed. A risk index for each of the four environmental hazards was calculated for each of the 8,642 ZIP codes, and the indexes were each divided into five categories of risk:
- Very low
- Low
- Moderate
- High
- Very high.
For the report, ATTOM Data Solutions analyzed 8,642 U.S. ZIP codes with sufficient housing trend data for the four environmental hazards.
A housing risk index was calculated for each of the four types of hazards in each of the 8,642 areas. The maximum index value for each index was 250 and the minimum value was 0.
A combined environmental hazard index comprised of these four factors and with a maximum possible score of 1,000 was assigned to each ZIP code. The highest actual score for any one area was 455. Each individual natural hazard index accounted for 25 percent of the combined index.
Keep reading to find out which ZIP codes rank highest in overall environmental hazard housing risks.
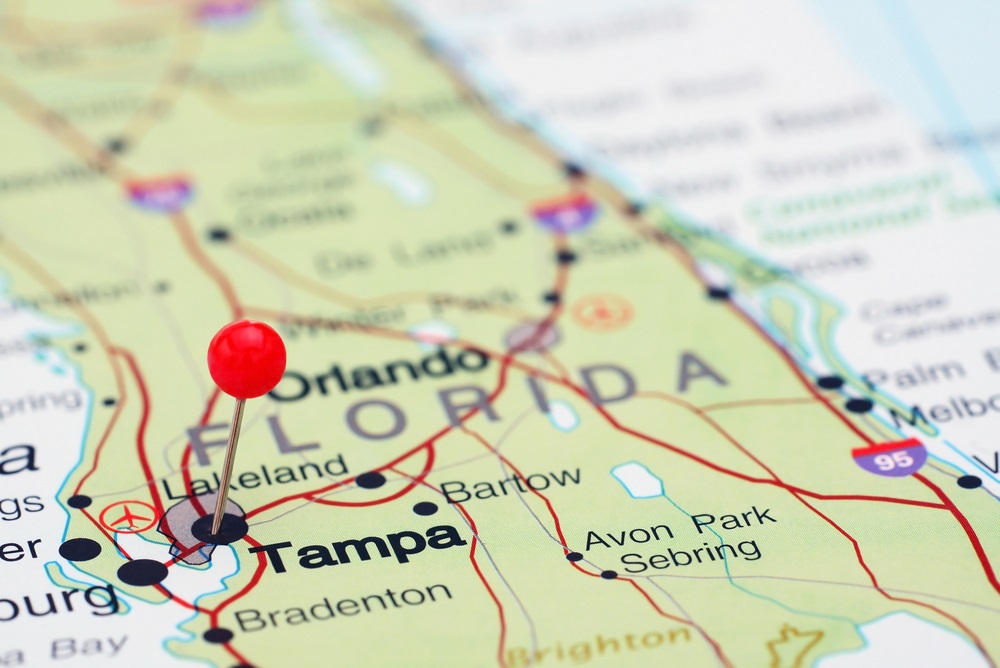
10. 33619 – Tampa, Florida
Overall risk Index: 285
2016 median sales prices: $88,000
Percentage seriously underwater: 27.5 percent
Foreclosure rate: 1.4 percent
9. 19526 – Hamburg, Pennsylvania
Overall risk Index: 287
2016 median sales prices: $148,250
Percentage seriously underwater: 9.6 percent
Foreclosure rate: 0.7 percent
8. 91752 – Mira Loma, California
Overall risk Index: 291
2016 median sales prices: $425,000
Percentage seriously underwater: 3.4 percent
Foreclosure rate: 0.3 percent
7. 63133 – Saint Louis, Missouri
Overall risk Index: 291
2016 median sales prices: $17,000
Foreclosure rate: 0.2 percent
6. 14303 – Niagara Falls, New York
Overall risk Index: 294
2016 median sales prices: $27,750
Percentage seriously underwater: 10.8 percent
Foreclosure rate: 0.2 percent
5. 93725 – Fresno, California
Overall risk Index: 339
2016 median sales prices: $158,000
Percentage seriously underwater: 16.2 percent
Foreclosure rate: 0.4 percent
4. 90670 – Santa Fe Springs, California
Overall risk Index: 356
2016 median sales prices: $435,000
Percentage seriously underwater: 3.4 percent
Foreclosure rate: 0.5 percent
3. 21226 – Curtis Bay, Maryland
Overall risk Index: 380
2016 median sales prices: $153,822
Percentage seriously underwater: 14.4 percent
Foreclosure rate: 0.7 percent
2. 92408 – San Bernardino, California
Overall risk Index: 400
2016 median sales prices: $197,500
Percentage seriously underwater: 13.3 percent
Foreclosure rate: 0.6 percent
1. 80216 – Denver, Colorado
Overall risk Index: 455
2016 median sales prices: $227,609
Percentage seriously underwater: 4.9 percent
Foreclosure rate: 0.2 percent
Source: PropertyCasualty360
Image: Shutterstock

