How are climate-related risks and opportunities affecting your organization’s businesses, strategy and financial planning? Increasingly, companies are asking themselves that question to prepare for an uncertain future.
Indeed, the impact of climate risk is a topic that regulators are considering as well. The Financial Stability Board set up the Task Force on Climate-related Financial Disclosures “to help identify the information needed by investors, lenders and insurance underwriters to appropriately assess and price climate-related risks and opportunities.”
These voluntary disclosures would give stakeholders a clearer picture of how companies perceive and are addressing climate risks. And the National Association of Insurance Commissioners’ Insurer Climate Risk Disclosure Survey, adopted in 2010, is now mandatory for larger insurers.
The Actuaries Climate Index (ACI), a monitoring tool launched in November 2016 by four North American actuarial organizations, may be helpful to insurance companies in answering these types of questions and in managing climate-related risks and opportunities.
Why are actuaries weighing in on climate risk?
Actuaries are experienced in the assessment and mitigation of the financial consequences of risks and in the summarization and presentation of complex data for decision-making. A changing climate is having a financial impact on insurance consumers and providers, and actuaries are well positioned to conduct deep analysis to map out what has been happening in recent decades. The Actuaries Climate Index was developed by the Climate Change Committee, a joint effort of the American Academy of Actuaries, the Canadian Institute of Actuaries, the Casualty Actuarial Society, and the Society of Actuaries.
What is the Actuaries Climate Index?
The ACI is an educational tool designed to help inform actuaries, public policymakers and the general public about climate trends and their potential impact. A quarterly measure of changes in extreme weather events and sea levels, the ACI is based on analysis of quarterly seasonal data for six different index components collected from 1961 through the latest available season, compared to the 30-year reference period of 1961 to 1990. The ACI is available online at ActuariesClimateIndex.org.
The ACI divides the continental United States and Canada into 12 different regions. Higher index values indicate an increase in the occurrence of extreme weather events.
The risk measured by the ACI is relative to the average frequencies during the reference period of 1961–1990. The data is from neutral, scientific sources, generating objective, evidence-based results on extreme weather events. According to the data analysis, 1.02 is the current five-year moving average value for the index. The index value remained below 0.25 during the reference period, reached a value of 0.5 in 1998, and first reached 1.0 in 2013. These values indicate an increase in the frequency of extreme weather occurrences and changes in sea levels to a sustained level above any single season (out of 120) during the reference period.
The ACI data is available for free on the website, which shows graphs and maps of the data by region and component. There is a guided tour to the website and documentation explaining how the index was developed and how it is calculated.
A second index, the Actuaries Climate Risk Index (ACRI), is based on the historical correlations of economic losses, mortality, and injuries to the ACI data, and is expected to be launched later this year. Regions used in the ACI follow state and provincial borders as shown in Figure 2.
The six components of the Actuaries Climate Index are:
- Warm temperatures (above the 90th percentile)
- Cold temperatures (below the 10th percentile)
- Heavy precipitation (maximum 5-day rainfall in each month)
- Drought (measured by consecutive dry days)
- Wind (above the 90th percentile)
- Sea level
For the purpose of combining the six components, the seasonal differences versus the reference period are divided by the statistical measure of variability in the reference period, the standard deviation. This approach allows such inherently different quantities to be combined in a single index while preserving the accuracy of the components. For each component, the index value indicates how unusual that season’s value is, compared to the reference period mean and standard deviation for that season. Hence, each component is in units of the standard deviation of that quantity.
The index components are approximately normally distributed, therefore, about one-third of the time one expects that index values will be outside the interval ±1, and one-sixth of the time it will be greater than +1. When it comes to the composite ACI, constructed as a combination of the components, the standard deviation is significantly less than 1, and thus a composite index value of 1 indicates a more unusual event than a similar value at the component level.
How insurers can use the Actuaries Climate Index
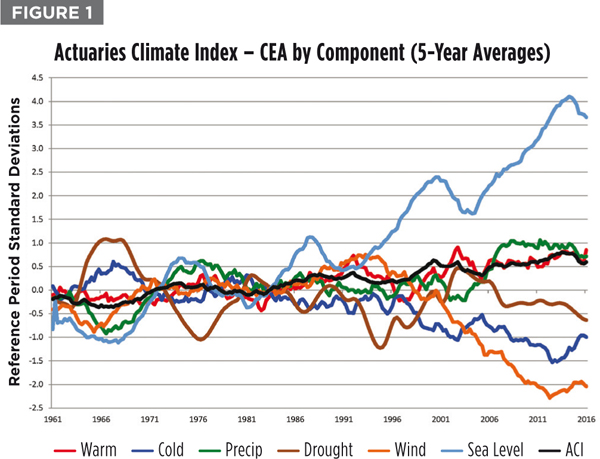
Data by region and component can be used to focus on areas where claim activity is most important to an insurance company. Concerned about sea levels or heavy rain in the northeastern United States? Data for the Central East Atlantic region (CEA) will show that sea level rise has been greater there than in any other region and that periods of heavy precipitation have been much more significant in recent years. Seasonal data underlying graphs such as Figure 3 could be modeled against claims data to help assess the risk — and then companies can incorporate their insights into pricing, underwriting, product development or claim department strategy. Monthly ACI data is also available.
The risk management implications of climate change will only continue to grow if current trends continue. Companies that incorporate climate data in their strategic planning will have a competitive edge. They will also be better able to answer climate disclosures and provide convincing information to regulators, shareholders and lenders that will demonstrate that they are effectively managing risks.
Climate change will have varying effects by class of business; property, casualty, life and health insurers will identify different risks and opportunities. Reinsurers will also be interested to know how their reinsureds are monitoring this aspect of their business. The ACI should also be useful to non-insurers in their financial planning and risk management.
Coverage decisions, such as where and whether to provide property or flood insurance, can be informed by historical climate statistics. Actuaries are increasingly using predictive models to measure correlations and trends for use in pricing, underwriting, claims management, marketing and enterprise risk management. The Actuaries Climate Index data is an important new input to these models. Where possible, the index components measure extremes, rather than averages, because extremes have the largest impact on people and property.
Some might say that climate change is gradual and should be a manageable risk for the insurance industry. At a presentation to actuaries in 2015, the audience was polled about how concerned the property and casualty insurance industry should be about the risks of climate change. Of the 121 poll respondents, 43 percent indicated that the risks of climate change are inadequately addressed. Is your company in this group?
The Actuaries Climate Index and the Actuaries Climate Risk Index will be useful additions to the analytical toolkit of insurers and other companies as they look to manage the risks of a changing climate.
Douglas J. Collins is a retired actuary and chair of the Casualty Actuarial Society’s Climate Change Committee. He worked for eight years at The Travelers, and spent the remainder of his career as a consulting actuary and principal with Tillinghast, Nelson & Warren, and its successor organization, Towers Perrin in the U.S., Bermuda and Europe.
Source: Property Casualty 360