Apr 20, 2017 | Blog-All, RIsk Management News
How are climate-related risks and opportunities affecting your organization’s businesses, strategy and financial planning? Increasingly, companies are asking themselves that question to prepare for an uncertain future.
Indeed, the impact of climate risk is a topic that regulators are considering as well. The Financial Stability Board set up the Task Force on Climate-related Financial Disclosures “to help identify the information needed by investors, lenders and insurance underwriters to appropriately assess and price climate-related risks and opportunities.”
These voluntary disclosures would give stakeholders a clearer picture of how companies perceive and are addressing climate risks. And the National Association of Insurance Commissioners’ Insurer Climate Risk Disclosure Survey, adopted in 2010, is now mandatory for larger insurers.
The Actuaries Climate Index (ACI), a monitoring tool launched in November 2016 by four North American actuarial organizations, may be helpful to insurance companies in answering these types of questions and in managing climate-related risks and opportunities.
Why are actuaries weighing in on climate risk?
Actuaries are experienced in the assessment and mitigation of the financial consequences of risks and in the summarization and presentation of complex data for decision-making. A changing climate is having a financial impact on insurance consumers and providers, and actuaries are well positioned to conduct deep analysis to map out what has been happening in recent decades. The Actuaries Climate Index was developed by the Climate Change Committee, a joint effort of the American Academy of Actuaries, the Canadian Institute of Actuaries, the Casualty Actuarial Society, and the Society of Actuaries.
What is the Actuaries Climate Index?
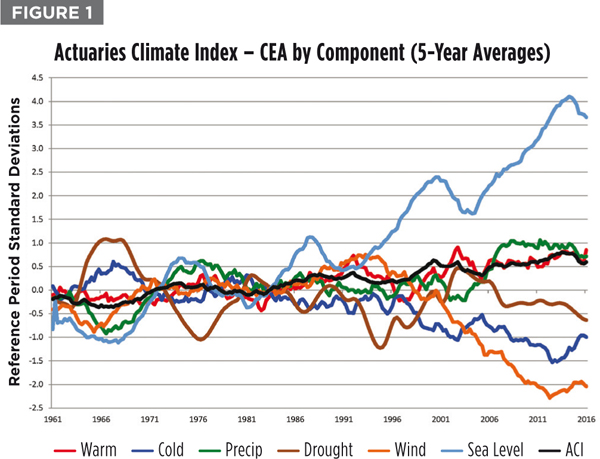
The ACI is an educational tool designed to help inform actuaries, public policymakers and the general public about climate trends and their potential impact. A quarterly measure of changes in extreme weather events and sea levels, the ACI is based on analysis of quarterly seasonal data for six different index components collected from 1961 through the latest available season, compared to the 30-year reference period of 1961 to 1990. The ACI is available online at ActuariesClimateIndex.org.
The ACI divides the continental United States and Canada into 12 different regions. Higher index values indicate an increase in the occurrence of extreme weather events.
The risk measured by the ACI is relative to the average frequencies during the reference period of 1961–1990. The data is from neutral, scientific sources, generating objective, evidence-based results on extreme weather events. According to the data analysis, 1.02 is the current five-year moving average value for the index. The index value remained below 0.25 during the reference period, reached a value of 0.5 in 1998, and first reached 1.0 in 2013. These values indicate an increase in the frequency of extreme weather occurrences and changes in sea levels to a sustained level above any single season (out of 120) during the reference period.
The ACI data is available for free on the website, which shows graphs and maps of the data by region and component. There is a guided tour to the website and documentation explaining how the index was developed and how it is calculated.
A second index, the Actuaries Climate Risk Index (ACRI), is based on the historical correlations of economic losses, mortality, and injuries to the ACI data, and is expected to be launched later this year. Regions used in the ACI follow state and provincial borders as shown in Figure 2.
The six components of the Actuaries Climate Index are:
- Warm temperatures (above the 90th percentile)
- Cold temperatures (below the 10th percentile)
- Heavy precipitation (maximum 5-day rainfall in each month)
- Drought (measured by consecutive dry days)
- Wind (above the 90th percentile)
- Sea level
For the purpose of combining the six components, the seasonal differences versus the reference period are divided by the statistical measure of variability in the reference period, the standard deviation. This approach allows such inherently different quantities to be combined in a single index while preserving the accuracy of the components. For each component, the index value indicates how unusual that season’s value is, compared to the reference period mean and standard deviation for that season. Hence, each component is in units of the standard deviation of that quantity.
The index components are approximately normally distributed, therefore, about one-third of the time one expects that index values will be outside the interval ±1, and one-sixth of the time it will be greater than +1. When it comes to the composite ACI, constructed as a combination of the components, the standard deviation is significantly less than 1, and thus a composite index value of 1 indicates a more unusual event than a similar value at the component level.
How insurers can use the Actuaries Climate Index
Data by region and component can be used to focus on areas where claim activity is most important to an insurance company. Concerned about sea levels or heavy rain in the northeastern United States? Data for the Central East Atlantic region (CEA) will show that sea level rise has been greater there than in any other region and that periods of heavy precipitation have been much more significant in recent years. Seasonal data underlying graphs such as Figure 3 could be modeled against claims data to help assess the risk — and then companies can incorporate their insights into pricing, underwriting, product development or claim department strategy. Monthly ACI data is also available.
The risk management implications of climate change will only continue to grow if current trends continue. Companies that incorporate climate data in their strategic planning will have a competitive edge. They will also be better able to answer climate disclosures and provide convincing information to regulators, shareholders and lenders that will demonstrate that they are effectively managing risks.
Climate change will have varying effects by class of business; property, casualty, life and health insurers will identify different risks and opportunities. Reinsurers will also be interested to know how their reinsureds are monitoring this aspect of their business. The ACI should also be useful to non-insurers in their financial planning and risk management.
Coverage decisions, such as where and whether to provide property or flood insurance, can be informed by historical climate statistics. Actuaries are increasingly using predictive models to measure correlations and trends for use in pricing, underwriting, claims management, marketing and enterprise risk management. The Actuaries Climate Index data is an important new input to these models. Where possible, the index components measure extremes, rather than averages, because extremes have the largest impact on people and property.
Some might say that climate change is gradual and should be a manageable risk for the insurance industry. At a presentation to actuaries in 2015, the audience was polled about how concerned the property and casualty insurance industry should be about the risks of climate change. Of the 121 poll respondents, 43 percent indicated that the risks of climate change are inadequately addressed. Is your company in this group?
The Actuaries Climate Index and the Actuaries Climate Risk Index will be useful additions to the analytical toolkit of insurers and other companies as they look to manage the risks of a changing climate.
Douglas J. Collins is a retired actuary and chair of the Casualty Actuarial Society’s Climate Change Committee. He worked for eight years at The Travelers, and spent the remainder of his career as a consulting actuary and principal with Tillinghast, Nelson & Warren, and its successor organization, Towers Perrin in the U.S., Bermuda and Europe.
Source: Property Casualty 360

Apr 11, 2017 | Blog-All, Informative
As the calendar turns to April, families gear up for spring break car trips or college visits. With better weather, more drivers take day trips or plan weekend getaways. This all adds up to more drivers on the road, and more potential for distracted driving – which also increases the odds of traffic accidents with bodily injuries.
But April is also Distracted Driving Awareness Month, the time of year when the National Safety Council and other organizations join forces to heighten awareness of distracted driving.
According to the National Highway Traffic Safety Administration (NHTSA) distracted driving is defined as any activity that diverts attention from driving, including talking or texting on your phone, eating and drinking, talking to people in your vehicle, or fiddling with the sound, entertainment or navigation system — anything that takes your attention away from the task of safe driving.
NHTSA calls texting “the most alarming distraction” because tests show that sending or reading a text takes your eyes off the road for five seconds. At 55 mph, that’s the equivalent of driving the length of an entire football field with your eyes closed, NHTSA explains.
According to Driver Electronic Device Use in 2015, a Sept. 2016 report from NHTSA, the percentage of passenger vehicle drivers text-messaging or visibly manipulating handheld devices remained constant at 2.2 percent in 2015. Driver handheld cell phone use decreased from 4.3 percent in 2014 to 3.8 percent in 2015, but NHTSA says this was not a statistically significant decrease.
The Property Casualty Insurers Association of America (PCI) is joining nationwide efforts to promote the importance of distracted driving awareness. One of the most frightening trends, PCI says, is the ubiquitous use of smartphones behind the wheel.
“Distracted driving is thought to be one of the leading causes for the rise in vehicle accidents. Whether it’s making a quick call, firing off a text, or adjusting the navigation system, in that short lapse of focus, all too often drivers can cause or fail to avoid a crash. And our increasingly congested roads compound the problem,” said Bob Passmore, PCI’s assistant vice president, personal lines policy.
The implementation and enforcement of distracted-driving laws, which discourage texting while driving and ban handheld cellphone use, are important first steps, PCI says.
“Auto safety is a top issue for auto insurers. We hope the dialogue on distracted and impaired driving will continue, and we urge lawmakers and other industry thought leaders to continue addressing the impact of motorist behavior as an important part of the safety equation,” added Passmore.
Employers and distracted drivers
Not only is distracted driving dangerous for individuals, the Insurance Information Institute ( I.I.I.) points out, but there is a growing concern among business owners and managers that they may be held liable for accidents caused by their employees while driving and conducting work-related conversations on cellphones. I.I.I. explains that under the doctrine of “vicarious responsibility,” employers may be held legally accountable for the negligent acts of employees committed in the course of employment. Employers may also be found negligent if they fail to put in place a policy for the safe use of cellphones.
Here are the top 7 safety tips from PCI and I.I.I. to help you, your employees, your family members and your clients avoid distracted driving.
1. Wear your seat belt.
Whether you’re taking a weekend get-away or just running errands around town, PCI encourages you to buckle up, drive safely and try to be prepared for those who may not. All passengers should be buckled up, even in the back seat.
Seat belts save lives and help prevent injuries. Also, make sure children are in the proper car or booster seats.
2. Plan ahead and allow extra travel time.
With more people on the roads, often driving in unfamiliar territory, the potential for a traffic crash increases. PCI encourages motorists to plan their routes in advance when traveling to new destinations, be patient, and allow for extra travel time.
Some auto accident reconstruction experts suggest that blindly following GPS systems has caused increases in accidents. If you’re going to use an electronic navigation system, check the directions before you start driving to be sure you understand where the system is taking you and where the turns are.
3. Observe speed limits, including lower speeds in work zones.
Stay focused on the road and be aware of changing traffic patterns caused by construction.
Be cautious of the construction workers themselves, who are often in close proximity to the highway—and at great risk.
Many states have increased fines in work zones, yet another reason to be more cautious.
Also, be aware that construction on major highways often takes place at night, when there is less traffic, but reduced visibility.
4. Avoid distracted driving.
When the entire family is traveling in the car, the opportunity for distraction is multiplied.
Remember to put the phone down, and never text while driving.
Be careful when eating on the run, as lunch can be just as distracting as a cell phone. As I.I.I. notes, eating takes both your hand off the wheel and your eyes off the road, so don’t do it. Furthermore, spills can easily cause an accident. If you have to stop short, you could also be severely burned.
Buckle up or secure pets in the back of the car. Never allow your pet to ride in your lap while you’re driving.
5. Have a plan for roadside assistance.
If an accident occurs, be wary of unscrupulous towing companies. Have the phone number for your insurer or a roadside assistance program ready so you know who to call.
Some towing companies take advantage of drivers after an accident, and you could find yourself facing excessive fees or complications recovering your car from the tow yard.
6. Update your proof of insurance.
Before hitting the road, make sure to replace any expired insurance identification cards so you can prove you have insurance in the event of an accident or a traffic stop.
You should also check traffic laws for any states that you’ll be driving through or staying in.
7. Use safe phone habits.
I.I.I. advises drivers to pull off the road to a safe location if you must use the phone or text with someone.
If you must dial from the road, use voice-activated dialing. Program frequently called numbers and your local emergency number into your phone and use voice-activated dialing.
Let your voice mail pick up your calls while you’re driving. It’s easy — and much safer — to retrieve your messages later on.
If you must make or receive a call while driving, keep conversations brief so you can concentrate on your driving. If a long discussion is required or if the topic is stressful or emotional, end the conversation and continue it once you are off the road.
Source: Property Casualty 360
Photo: Shutter Stock

Apr 3, 2017 | Blog-All, Informative, RIsk Management News
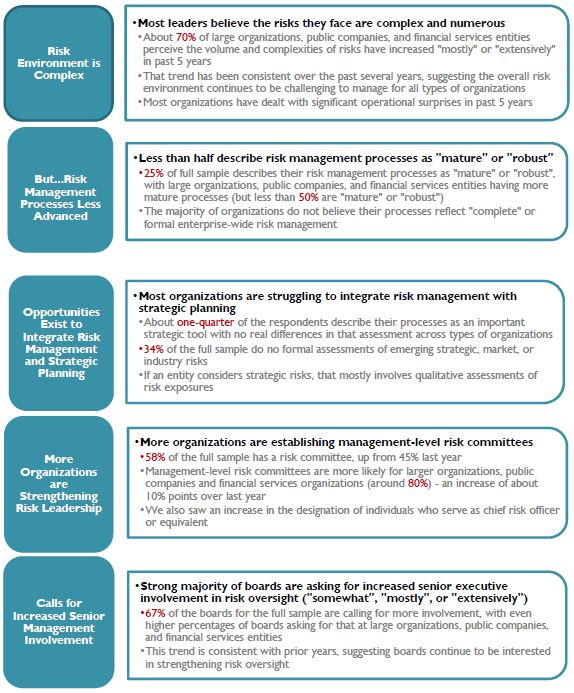
More organizations are recognizing the value of a structured focus on emerging risks. The number of organizations with a complete enterprise risk management (ERM) program in place has steadily risen from 9% in 2009 to 28% in 2016, according to the N.C. State Poole College of Management’s survey “The State of Risk Oversight: An Overview of Enterprise Risk Management Practices.”
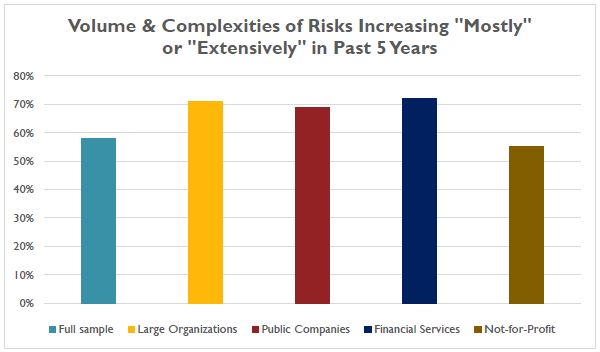
Yet this progress may lag behind the increasingly complicated risks that need addressing. Of respondents, 20% noted an “extensive” increase in the volume and complexity of risks the past five years, with an additional 38% saying the volume and complexity of risks have increased “mostly.” This is similar to participant responses in the most recent prior years. In fact, only 2% said the volume and complexity of risks have not changed at all.
Even with improvements in the number of programs implemented, the study—which is based on responses of 432 executives from a variety of industries—found there is room for improvement. Overall, 26% of respondents have no formal enterprise-wide approach to risk oversight and currently have no plans to consider this form of risk oversight.
Organizations that do have programs continue to struggle to integrate their risk oversight efforts with strategic planning processes. “Significant opportunities remain for organizations to continue to strengthen their approaches to identifying and assessing key risks facing the entity especially as it relates to coordinating these efforts with strategic planning activities,” the researchers found.
According to the study:
Many argue that the volume and complexity of risks faced by organizations today continue to evolve at a rapid pace, creating huge challenges for management and boards in their oversight of the most important risks. Recent events such as Brexit, the U.S. presidential election, immigration challenges, the constant threat of terrorism, and cyber threats, among numerous other issues, represent examples of challenges management and boards face in navigating an organization’s risk landscape.
Key findings include:
Source: Risk Management Monitor

Mar 21, 2017 | Blog-All, RIsk Management News
According to a 2013 research report published jointly by MIT and PwC, over 69% of companies surveyed experienced a supply chain disruption that resulted in a 3% or higher increase in total supply chain costs. Meanwhile, a 2014 survey of supply chain executives conducted by the Global Supply Chain Institute found that “many supply chain execs have done very little to formally manage supply chain risks.”
With so much on the line, why has there been so little focus on supply chain risk mitigation? Until recently, there have been no supply chain-focused risk management tools that enable organizations to manage both catastrophic risks (natural disasters), that result in major supply chain disruptions, and operational risks (port congestion), that destroy supply chain performance by a thousand cuts.
Download this white paper to learn how real-time big data and machine learning are enabling transformative new capabilities for risk detection, mapping, visibility and fast response:
- Dynamically discovering and modeling all nodes, facilities, assets, trading partners and customers in the end-to-end supply chain, continuously
- Enabling real-time visibility into unfolding interdependent risks and disruptions
- Performing dynamic, frequent assessments of risks unfolding in real-time and those predicted to occur based on behavioral modeling
- Producing prescriptive recommendations for risk remediation, and facilitating intelligent actions
Source: RIMS

Mar 15, 2017 | Blog-All, RIsk Management News
Environmental hazards present risk for all homeowners throughout the U.S. Certain areas are well known for the risks they entail, but there are those ZIP codes that still fly under the radar for environmental hazards despite being hot spots.
According to recent research by ATTOM Data Solutions, 17.3 million single-family homes and condominiums with a combined estimated market value of $4.9 trillion are in ZIP codes with high or very high risk for at least one of four environmental hazards:
- Superfunds (sites contaminated with pollutants and other harmful substances)
- Brownfields (properties that may have hazardous substances, pollutants or contaminants present)
- Polluters
- Poor air quality
The 17.3 million single family homes and condos in high-risk ZIP codes represented 25 percent of the 68.1 million single-family homes and condos in the 8,642 ZIP codes analyzed. A risk index for each of the four environmental hazards was calculated for each of the 8,642 ZIP codes, and the indexes were each divided into five categories of risk:
- Very low
- Low
- Moderate
- High
- Very high.
For the report, ATTOM Data Solutions analyzed 8,642 U.S. ZIP codes with sufficient housing trend data for the four environmental hazards.
A housing risk index was calculated for each of the four types of hazards in each of the 8,642 areas. The maximum index value for each index was 250 and the minimum value was 0.
A combined environmental hazard index comprised of these four factors and with a maximum possible score of 1,000 was assigned to each ZIP code. The highest actual score for any one area was 455. Each individual natural hazard index accounted for 25 percent of the combined index.
Keep reading to find out which ZIP codes rank highest in overall environmental hazard housing risks.
10. 33619 – Tampa, Florida
Overall risk Index: 285
2016 median sales prices: $88,000
Percentage seriously underwater: 27.5 percent
Foreclosure rate: 1.4 percent
9. 19526 – Hamburg, Pennsylvania
Overall risk Index: 287
2016 median sales prices: $148,250
Percentage seriously underwater: 9.6 percent
Foreclosure rate: 0.7 percent
8. 91752 – Mira Loma, California
Overall risk Index: 291
2016 median sales prices: $425,000
Percentage seriously underwater: 3.4 percent
Foreclosure rate: 0.3 percent
7. 63133 – Saint Louis, Missouri
Overall risk Index: 291
2016 median sales prices: $17,000
Percentage seriously underwater: 45.4 percent
Foreclosure rate: 0.2 percent
6. 14303 – Niagara Falls, New York
Overall risk Index: 294
2016 median sales prices: $27,750
Percentage seriously underwater: 10.8 percent
Foreclosure rate: 0.2 percent
5. 93725 – Fresno, California
Overall risk Index: 339
2016 median sales prices: $158,000
Percentage seriously underwater: 16.2 percent
Foreclosure rate: 0.4 percent
4. 90670 – Santa Fe Springs, California
Overall risk Index: 356
2016 median sales prices: $435,000
Percentage seriously underwater: 3.4 percent
Foreclosure rate: 0.5 percent
3. 21226 – Curtis Bay, Maryland
Overall risk Index: 380
2016 median sales prices: $153,822
Percentage seriously underwater: 14.4 percent
Foreclosure rate: 0.7 percent
2. 92408 – San Bernardino, California
Overall risk Index: 400
2016 median sales prices: $197,500
Percentage seriously underwater: 13.3 percent
Foreclosure rate: 0.6 percent
1. 80216 – Denver, Colorado
Overall risk Index: 455
2016 median sales prices: $227,609
Percentage seriously underwater: 4.9 percent
Foreclosure rate: 0.2 percent
Source: PropertyCasualty360
Image: Shutterstock

Mar 2, 2017 | Blog-All, Informative
WASHINGTON, D.C. (March 1, 2017) —The National Association of Insurance Commissioners (NAIC) released two sets of data today on life/fraternal and property/casualty insurers. The reports provide market share information indicating the degree of market concentration in lines of business and identify leading insurance writers.
The 2016 market share reports include countrywide direct written premium for the top 25 groups and companies as reported on the state page of the annual statement for insurers that report to the NAIC.
The property/casualty report contains cumulative market share data for the following lines of business: personal auto, commercial auto, workers’ compensation, medical professional liability, homeowners and other liability (excluding auto liability) insurance. The life/fraternal market share report contains cumulative market share data for: life; annuity considerations; and aggregate total of life insurance, annuity considerations, deposit-type contract funds, other considerations and accident/health insurance.
The reports will be refreshed daily through March 3 and then each Monday throughout March. Abbreviated versions of the Life/Fraternal and Property/Casualty reports are also available. The complete 2016 Market Share Reports for Life/Fraternal and 2016 Market Share Reports for Property/Casualty will be available this summer and contain more in-depth information.
For questions about the reports or data, contact the NAIC Research & Actuarial Department.
About the NAIC
The National Association of Insurance Commissioners (NAIC) is the U.S. standard-setting and regulatory support organization created and governed by the chief insurance regulators from the 50 states, the District of Columbia and five U.S. territories. Through the NAIC, state insurance regulators establish standards and best practices, conduct peer review, and coordinate their regulatory oversight. NAIC staff supports these efforts and represents the collective views of state regulators domestically and internationally. NAIC members, together with the central resources of the NAIC, form the national system of state-based insurance regulation in the U.S. For more information, visit www.naic.org.
Source: NAIC